How Can You Improve PCR Amplification Efficiency?
Poor PCR amplification efficiency can turn a carefully planned experiment into a week of weak bands, late Cq values, and confusing repeat runs. The good news is that the cause is usually traceable. Primer design, template purity, annealing temperature, magnesium levels, inhibitors, and pipetting errors are among the most common factors.
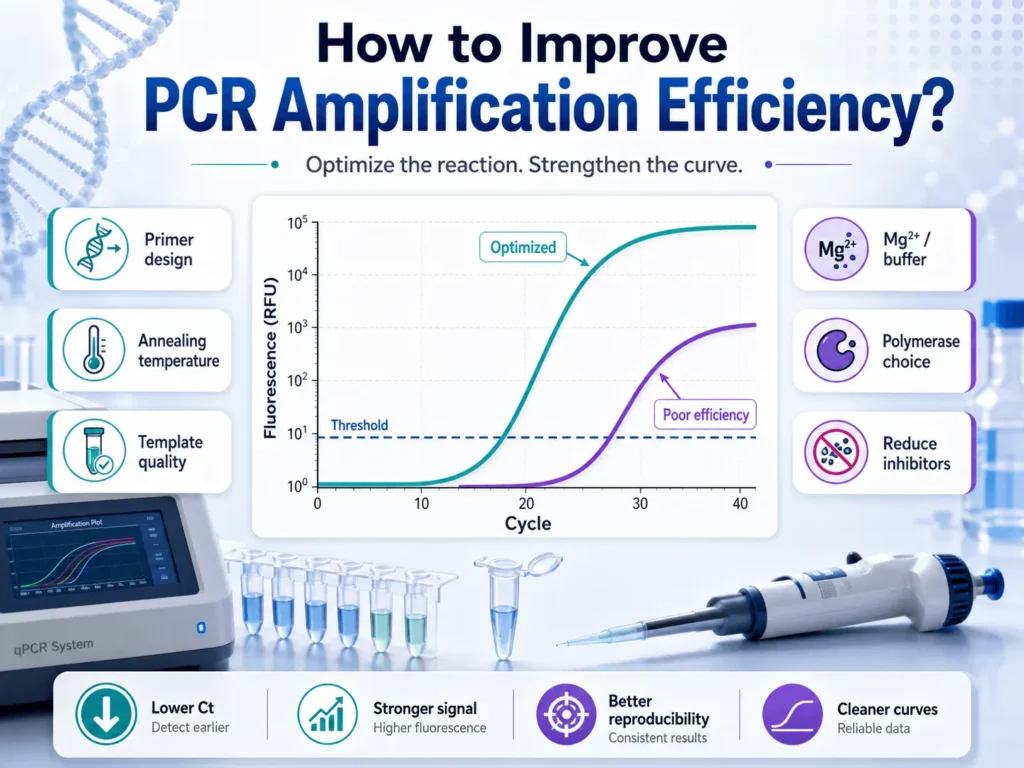
For qPCR, an amplification efficiency of 90% to 110% is generally accepted, with 100% representing a near doubling of the target during each cycle. Conventional PCR does not always produce a numerical efficiency value, so success is judged through product yield, specificity, and repeatability.
The best way to improve PCR amplification efficiency is to change one condition at a time. Begin with primer specificity and template quality. Then test annealing temperature, template input, magnesium concentration, and reagent balance. This controlled approach helps reveal the real cause rather than hiding it behind several simultaneous changes.
What is PCR amplification efficiency?
PCR amplification efficiency describes how successfully the target sequence is copied during each amplification cycle. At 100% efficiency, the amount of target DNA doubles during the exponential phase of every cycle.
Perfect doubling rarely continues through the full reaction. Reagents become limited, polymerase activity falls, and accumulated products begin competing with primers. Efficiency measurements are based on the exponential phase, before these late-cycle effects become dominant.
Amplification can be described using the following relationship:
N = N₀ × (1 + E)ⁿ
In this equation:
N₀ is the starting amount of target DNA.
N is the amount produced after amplification.
E is efficiency written as a decimal.
n is the number of cycles.
An efficiency of 1.0 represents 100% efficiency. An efficiency of 0.90 represents 90%.
A reaction can produce a visible band while still having poor amplification efficiency. Likewise, a very bright band does not prove that the correct product was amplified. Nonspecific products and primer-dimers can also consume primers, nucleotides, polymerase activity, and fluorescent dye.
What is considered good PCR efficiency?
A well-performing qPCR assay commonly has an efficiency between 90% and 110%. This range corresponds roughly to a standard-curve slope between −3.1 and −3.6, depending on the calculation and rounding method used. A slope of about −3.32 represents 100% efficiency.
Efficiency below 90% means amplification is occurring more slowly than expected. Possible causes include inhibitors, poor primer binding, damaged template, long amplicons, secondary structure, unsuitable cycling conditions, or an overloaded reaction.
A result above 110% does not mean the polymerase is producing more than two accurate copies from each template molecule. It usually points to a technical or analytical problem, such as inaccurate serial dilutions, nonspecific amplification, primer-dimers, threshold placement, contamination, or inhibition that varies across the dilution series.
Efficiency should not be read alone. The standard curve’s linearity, replicate agreement, melt-curve profile, negative controls, and amplification-curve shape also matter. The MIQE guidelines call for reporting assay efficiency, standard-curve slope, linear dynamic range, and supporting validation information when qPCR results are published.
How can PCR amplification efficiency be improved?
PCR amplification efficiency improves when the target is accessible, primers bind selectively, and reaction components remain within working concentrations. The most reliable method is to test each major variable separately while keeping the rest of the reaction unchanged.
Start with better primer design
Primer design is often the first place to look because no reagent adjustment can fully rescue primers that bind poorly or amplify several genomic regions.
A good primer pair should bind the intended target strongly while showing little tendency to form hairpins, self-dimers, or cross-dimers. Complementarity at the 3′ ends deserves close attention because polymerase extends from this end. Two primers with strongly complementary 3′ sequences may create primer-dimers that compete with the intended template.
For qPCR, short amplicons are usually preferred because they amplify more readily than long products. Many qPCR assays use products around 70 to 200 base pairs, although the suitable length depends on the assay chemistry, target, and instrument. Primer design and target selection directly affect amplification specificity and efficiency.
Check new primers against the relevant genome or transcript database. A primer pair may look suitable in isolation but still match pseudogenes, related gene families, repetitive regions, or unintended transcripts.
Both primers should have similar melting temperatures. A large difference creates a narrow temperature range in which both primers bind properly. Avoid placing primers across regions with strong secondary structure, extreme GC content, long nucleotide repeats, or common sequence variants.
For RT-qPCR, exon-exon junction primers can reduce amplification from genomic DNA when the transcript structure allows it. Another option is to place the primers in separate exons divided by a large intron, producing a much longer genomic product than the cDNA product.
Use clean and intact template DNA
PCR needs more than DNA presence. The target must be intact, accessible, and free from substances that interfere with polymerase.
Poor extraction can leave behind phenol, ethanol, detergents, salts, heme, proteins, polysaccharides, humic compounds, or other sample-specific contaminants. These substances may delay amplification, lower reaction yield, widen replicate variation, or stop amplification entirely. Common PCR inhibitors include extraction chemicals and residual compounds from blood, tissue, plants, bodily fluids, and soil.
Check nucleic acid concentration using a suitable fluorometric method when accurate input matters. Absorbance readings can overestimate DNA concentration because RNA, free nucleotides, and some contaminants also absorb ultraviolet light.
Purity ratios can provide clues, but they do not prove that a sample is free of PCR inhibitors. A sample can show acceptable absorbance ratios and still inhibit amplification.
Template integrity also matters. Repeated freeze-thaw cycles, harsh extraction conditions, nuclease activity, and long storage under unsuitable conditions can fragment DNA or RNA. Degradation becomes especially troublesome when the intended amplicon is long.
A useful inhibitor check is to run the sample at two or more input dilutions. Better amplification after dilution often suggests that the original sample contained too much inhibitor.
Test a lower template input
Adding more DNA does not always produce better amplification. Excess template may introduce more inhibitors, increase viscosity, disturb reagent ratios, and raise the chance of nonspecific primer binding.
Run a small template dilution series while keeping the reaction volume unchanged. For example, compare undiluted template with 1:5, 1:10, and 1:20 dilutions.
A diluted sample may produce an earlier or cleaner result than the concentrated sample when inhibition is present. In qPCR, a tenfold dilution should produce a predictable Cq difference when the assay is working properly. Large departures from the expected pattern may point to dilution error, inhibition, or poor assay performance.
Very little template can also cause trouble. Low-copy targets may amplify inconsistently because some wells receive few or no target molecules. This sampling problem can look like poor reaction efficiency even when the chemistry itself is sound.
Find the best annealing temperature
Annealing temperature controls the balance between primer binding and specificity. A temperature that is too low allows primers to bind imperfectly, leading to extra bands and primer-dimers. A temperature that is too high can block productive binding and lower product yield.
Begin near the primer pair’s calculated melting temperature, then run a temperature gradient. A gradient across roughly 5°C to 10°C can quickly show where the desired product is strongest and unwanted products are lowest.
A common starting point for conventional PCR is an annealing temperature around 3°C to 5°C below the lower primer melting temperature. This is only a starting estimate. Buffer chemistry, primer sequence, magnesium levels, and the polymerase system can change the working temperature. A widely used basic PCR protocol describes annealing near 5°C below apparent primer melting temperature, followed by refinement for the specific assay.
Do not choose the condition that gives the brightest total signal without checking specificity. The better temperature is the one that produces the correct target consistently with little or no competing product.
Touchdown PCR can help when ordinary gradient testing still produces several bands. The reaction starts at a higher annealing temperature and gradually moves downward over early cycles. Early amplification favors the best primer-target matches, reducing the chance that unwanted products dominate later cycles.
Adjust magnesium concentration carefully
Magnesium ions support polymerase activity and influence primer-template binding. Too little magnesium can produce weak or absent amplification. Too much can increase nonspecific products and reduce copying accuracy.
Magnesium also interacts with dNTPs, primers, template DNA, and buffer components. This means the best concentration cannot be selected without considering the whole reaction mixture.
For standard Taq DNA polymerase, 1.5 to 2.0 mM Mg²⁺ is a common starting range, although the working concentration varies across enzymes and assays.
Test magnesium in small increments rather than making a large jump. A series such as 1.5, 2.0, 2.5, and 3.0 mM may reveal a useful range, provided those concentrations suit the polymerase and buffer system.
Commercial master mixes already contain magnesium at a fixed or partly fixed concentration. Read the manufacturer’s instructions before adding more. Unplanned supplementation can create nonspecific amplification that looks like increased yield.
Keep primer concentrations balanced
Too little primer limits amplification. Too much primer raises the chance of primer-dimers and unwanted binding.
Many PCR reactions begin with each primer in the approximate range of 0.1 to 0.5 µM. The best final concentration depends on the assay, enzyme, reaction chemistry, and detection method.
For qPCR, a primer matrix can be useful. Test several forward-primer concentrations against several reverse-primer concentrations. Compare Cq values, curve shape, replicate spread, melt peaks, and negative-control amplification.
Unequal concentrations may work when one primer behaves differently from the other, but balanced concentrations are a sensible starting point.
Primer stocks also need careful handling. Repeated freeze-thaw cycles, evaporation, contamination, and calculation mistakes can create apparent assay problems. Prepare working stocks, label concentrations clearly, and use calibrated pipettes.
Use the correct dNTP concentration
dNTPs are the building blocks used to create new DNA strands. Too little limits product formation. Too much can bind available magnesium and change the effective magnesium concentration.
Many standard PCR systems use about 200 µM of each dNTP, though the correct amount depends on the enzyme and supplied buffer. It is safer to begin with the polymerase manufacturer’s recommended formulation than to copy concentrations from an unrelated assay.
Old or repeatedly thawed dNTP stocks can become unreliable. Store them in small portions and avoid unnecessary warming.
Choose a polymerase suited to the target
Different DNA polymerases are built for different tasks. Standard Taq works well for many routine targets, but difficult templates may need a hot-start enzyme, a high-fidelity enzyme, or a blend designed for GC-rich or long products.
Hot-start polymerases remain inactive during reaction setup and become active during the initial heating step. This reduces extension from primers that bind incorrectly at room temperature. The result is often cleaner amplification and less primer-dimer formation.
High-fidelity enzymes offer lower error rates, but their buffer requirements and cycling conditions can differ from those used for Taq. A direct substitution without changing the protocol may reduce yield.
Long amplicons need enzymes with suitable processivity and longer extension times. GC-rich targets may need a polymerase system made for stable secondary structures.
For qPCR, use chemistry validated for the selected detection method. SYBR-type dyes detect any double-stranded DNA, including unwanted products. Probe-based assays add another sequence-specific step, though poor primer performance can still lower efficiency.
Match extension time to amplicon length
An extension step that is too short may leave products incomplete. Excessively long extension periods rarely fix poor primer binding and may lengthen the run without improving the result.
The correct extension speed depends on the enzyme. Traditional Taq protocols commonly use about one minute per kilobase, while many newer polymerases copy DNA much faster. Follow the stated extension rate for the exact enzyme rather than applying one timing rule to every system.
The extension temperature must also match the polymerase. Standard Taq commonly extends near 72°C, but some fast or combined annealing-extension protocols use different conditions.
For short qPCR amplicons, annealing and extension are often combined into one step. If efficiency remains poor, test a modestly longer combined step before changing several other variables.
Use enough denaturation without damaging the enzyme
Initial denaturation must open the template and activate a hot-start polymerase when required. GC-rich templates or complex genomic DNA may need more time than short, simple templates.
Long denaturation during every cycle can reduce polymerase activity and damage DNA. Use the shortest period that reliably separates the strands.
The selected temperature matters too. Many protocols use 94°C to 95°C, while certain enzymes are designed for 98°C. Applying 98°C to an enzyme that lacks sufficient heat stability can gradually lower reaction performance.
Remove PCR inhibitors
When inhibition is suspected, dilution is often the fastest diagnostic step. If dilution restores amplification, clean the nucleic acid again or use less template per reaction.
Possible corrective actions include:
- Repeating column cleanup or magnetic-bead purification
- Adding a suitable wash step during extraction
- Fully removing residual ethanol
- Changing the extraction method for the sample type
- Diluting the template
- Using an inhibitor-tolerant polymerase
- Adding bovine serum albumin when supported by the assay protocol
The right response depends on the inhibitor. Bovine serum albumin may help with some environmental or tissue-derived compounds, but it will not correct every extraction problem.
An internal amplification control can separate true target absence from reaction inhibition. This is particularly useful in diagnostic, food, wastewater, soil, and clinical assays where the sample matrix varies.
Try additives for GC-rich templates
GC-rich DNA forms stable structures that resist strand separation and block primer access. Additives can weaken these structures and make the target easier to copy.
DMSO, betaine, formamide, and commercial GC enhancers are commonly tested. They are not interchangeable, and excessive amounts may reduce polymerase activity.
One published GC-rich PCR study found that 5% DMSO, suitable template input, and adjusted magnesium supported amplification of its specific target. The same study also found that the best annealing temperature was higher than the value predicted from primer calculations. These values illustrate why difficult targets need direct testing rather than a universal recipe.
Start with the enzyme manufacturer’s additive range. Run an untreated control beside every additive condition so the effect remains clear.
Reduce unnecessary cycle numbers
Adding more cycles may create a visible product, but it does not repair low efficiency. Late cycles favor reagent depletion, plateau effects, background amplification, and accumulation of primer-dimers.
Conventional PCR often uses about 25 to 35 cycles, depending on target abundance and assay purpose. Very low-copy targets may need more, but each added cycle raises the chance of background products.
For qPCR, late Cq values need cautious treatment. A signal appearing near the end of the run may represent a true low-copy target, primer-dimer formation, contamination, or baseline noise. Review the curve shape, melt profile, replicate behavior, and controls before calling it positive.
How do you improve qPCR efficiency?
qPCR efficiency improves through a valid standard curve, clean dilution technique, specific amplification, and consistent reaction setup. The efficiency number is only trustworthy when the standard curve covers the assay’s working range and the dilutions are accurate.
Prepare a series of standards using several evenly spaced concentrations. Five or more dilution points are commonly used, with technical replicates at each point. The range should cover the expected sample concentrations without extending into levels where stochastic sampling dominates.
Use low-binding tubes when standards contain very little DNA. Mix every dilution thoroughly before transferring material into the next tube. Use a fresh pipette tip for each transfer.
A single inaccurate dilution can distort the slope and produce a false efficiency result. Serial dilution errors accumulate, so careful pipetting matters just as much as PCR chemistry.
Review the following features together:
- Efficiency within the chosen acceptance range
- A linear standard curve across the working concentrations
- Tight agreement among technical replicates
- A single expected melt peak for dye-based assays
- No meaningful amplification in the no-template control
- Stable amplification-curve shape across the dilution series
- Similar assay behavior across separate runs
A five-point curve with a good efficiency number can still be misleading when one point falls far from the regression line. Inspect the individual measurements rather than accepting the software summary without review.
How is PCR amplification efficiency calculated?
qPCR efficiency is commonly calculated from the slope of a standard curve. The curve plots Cq values against the logarithm of starting template quantity.
The calculation is:
Efficiency (%) = [10^(−1/slope) − 1] × 100
For a slope of −3.32:
Efficiency = [10^(−1/−3.32) − 1] × 100
Efficiency ≈ 100%
A slope more negative than expected, such as −3.8, gives an efficiency below the usual working range. A less negative slope, such as −2.9, gives an efficiency above 110% and often points to a dilution, inhibition, specificity, or analysis problem. Standard-curve slope is the established basis for this calculation.
Some software reports efficiency as an amplification factor rather than a percentage. An amplification factor of 2.0 means the target doubles per cycle and corresponds to 100%. An amplification factor of 1.9 corresponds to 90%.
Check how the instrument software defines the value before comparing results from different systems.
Why is PCR efficiency too low?
Low PCR efficiency means the target is not being copied at the expected rate during the exponential phase. The reaction may still produce detectable DNA, but sensitivity, repeatability, and quantitative accuracy can fall.
Common causes include poor primer binding, inhibitors, damaged template, a long or structured amplicon, excessive template, insufficient magnesium, unsuitable annealing temperature, weak polymerase activity, or inaccurate reagent preparation.
Start with three simple checks:
- Run a template dilution to test for inhibition.
- Run an annealing-temperature gradient.
- Check product specificity using a gel or melt curve.
These checks separate many template, temperature, and specificity problems before extensive reagent testing begins.
For RT-qPCR, poor reverse transcription can also appear as poor PCR performance. RNA degradation, genomic DNA contamination, reverse-transcription inhibitors, priming method, and variable cDNA synthesis can affect the final result even when the qPCR step works properly.
Why does qPCR efficiency exceed 100%?
Efficiency above 100% usually reflects a measurement problem rather than faster-than-doubling target replication. The calculated slope becomes too shallow when Cq spacing across the standard dilutions is smaller than expected.
Inaccurate serial dilution is a frequent cause. Pipetting a small volume, failing to mix completely, or transferring material left on the tube wall can alter the true concentration series.
Inhibition can also produce an efficiency above 100%. Concentrated standards may contain more inhibitor than dilute standards. Their amplification becomes disproportionately delayed, flattening the standard-curve slope.
Other causes include:
- Nonspecific amplification
- Primer-dimers
- Poor baseline correction
- Threshold placement outside the exponential phase
- Contaminated standards
- Too narrow a dilution range
- Very low-copy points with unstable detection
- Different sample matrices across standards
Rebuild the standards from an independent stock before changing the primer sequences. A fresh dilution series often reveals whether the unusual value came from assay chemistry or preparation error.
How can you tell whether the changes worked?
A successful change should improve more than product brightness. The correct amplicon should appear consistently, unwanted products should fall, and replicate variation should narrow.
For conventional PCR, run the products on a gel with a suitable DNA ladder. Look for a single band at the expected size. Smearing, several bands, or a strong low-molecular-weight band suggest that the reaction still needs work.
For dye-based qPCR, inspect the melt curve. A single sharp peak at the expected melting temperature supports one dominant product. Extra peaks or low-temperature peaks may indicate nonspecific products or primer-dimers.
Also compare:
- Cq values at the same template input
- Replicate spread
- Standard-curve slope
- Efficiency
- Linear working range
- Negative controls
- Product identity
Sequencing the amplicon gives stronger confirmation when exact identity matters. Gel size and melt temperature can support specificity, but different sequences can sometimes produce similar results.
A step-by-step PCR efficiency troubleshooting workflow
Randomly changing several reagents can produce a better reaction without revealing which change mattered. A fixed order makes the process easier to interpret and reproduce.
Step 1: Confirm the basic setup
Check primer sequences, stock concentrations, reaction calculations, cycling program, polymerase storage, and instrument settings. Confirm that no reagent was omitted or added at the wrong concentration.
Step 2: Review the controls
Check the positive control, no-template control, extraction blank, and no-reverse-transcription control where relevant. Control behavior can quickly separate contamination, extraction failure, and reaction failure.
Step 3: Test template dilution
Run several template inputs. Improvement after dilution points toward inhibitors or template overload.
Step 4: Run an annealing gradient
Select the temperature that gives strong target amplification with the least background product.
Step 5: Check primer specificity
Inspect the gel or melt curve. Redesign the primers when several unwanted products remain across a reasonable temperature range.
Step 6: Test magnesium or primer concentration
Change one variable across a small range. Keep the template, cycling program, and remaining reagents unchanged.
Step 7: Test a different polymerase system
Use a hot-start, inhibitor-tolerant, high-fidelity, long-range, or GC-focused enzyme when the target demands it.
Step 8: Rebuild the qPCR standard curve
Prepare fresh standards, use enough concentration points, mix each dilution fully, and run replicates.
Step 9: Confirm product identity
Check product size, melt behavior, and sequence when required.
Step 10: Record the final conditions
Document reagent lots, concentrations, cycling settings, template input, standard-curve results, and control outcomes. Small undocumented changes can make a working assay difficult to repeat months later.
Better PCR efficiency comes from controlled testing
Improving PCR amplification efficiency is rarely about finding one secret reagent. It comes from giving primers, template, polymerase, and cycling conditions the right environment to work together.
Begin with the parts that shape the whole reaction: primer specificity, template purity, and annealing temperature. Then test template input, magnesium, primer concentration, extension settings, and enzyme choice. For qPCR, rebuild questionable standards before drawing conclusions from an unusual efficiency value.
A strong assay should do more than produce fluorescence or a bright gel band. It should amplify the intended sequence across the working concentration range, show close agreement among replicates, keep negative controls clean, and perform consistently on different days. That level of reliability turns PCR from a hopeful experiment into a method you can trust.