Is It Possible for PCR Efficiency to Exceed 100%?
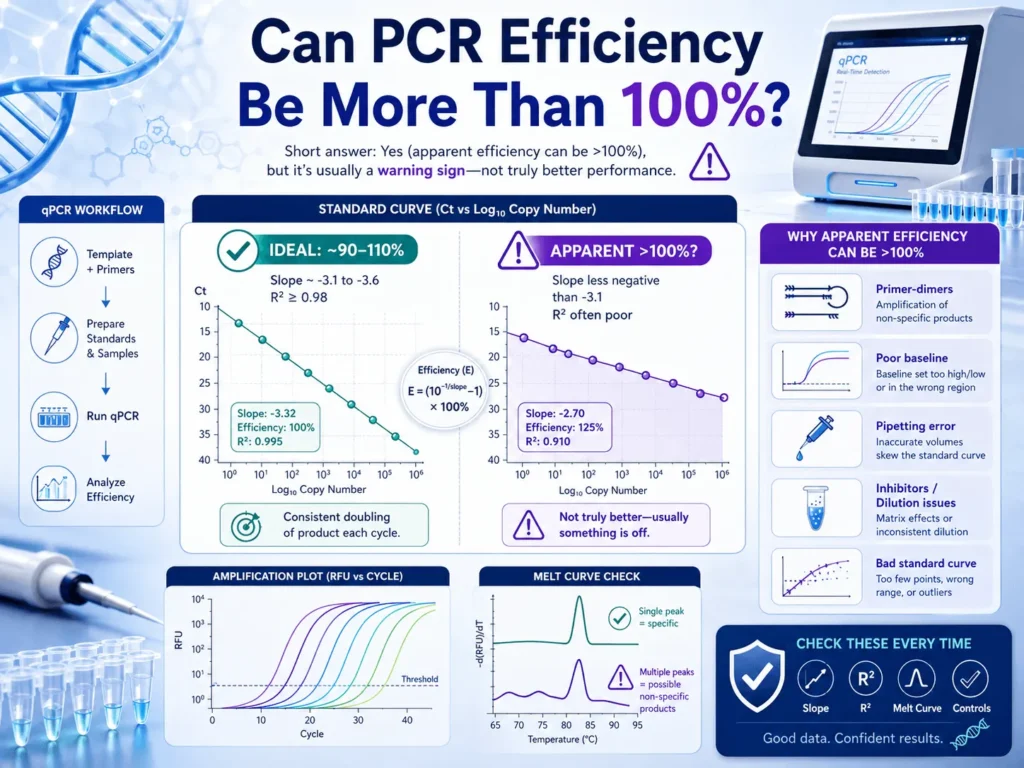
PCR efficiency can appear to exceed 100% when it is calculated from a qPCR standard curve. Yet the reaction itself is not truly creating more than twice the number of target molecules during each cycle. A result such as 105% may fall within a commonly accepted working range, while values such as 115%, 130%, or higher usually point to dilution errors, inhibitors, nonspecific amplification, poor threshold placement, or unreliable low-copy measurements.
The key distinction is between true amplification efficiency and calculated efficiency. True 100% efficiency means every target molecule produces two copies during one cycle. A reported value above that ceiling is usually a mathematical signal that the standard curve does not perfectly represent the reaction. Before using those results for gene expression or copy-number calculations, check the dilution series, amplification plots, melt curve, controls, and standard-curve slope.
What Does PCR Efficiency Mean?
PCR efficiency describes how much the amount of target DNA increases during each amplification cycle. In an ideal reaction, every existing target molecule is copied once, causing the target population to double.
A reaction containing 100 target molecules would theoretically contain:
- 200 molecules after one cycle
- 400 molecules after two cycles
- 800 molecules after three cycles
- 1,600 molecules after four cycles
This doubling represents 100% efficiency.
PCR efficiency is often expressed in two related ways. An amplification factor of 2.0 means the product doubles, while an efficiency value of 1.0 or 100% describes the increase above the starting quantity.
At 90% efficiency, the amplification factor is 1.9. Each cycle produces 1.9 times the previous quantity rather than a perfect twofold increase.
100% efficiency is described as the physical upper limit because one double-stranded DNA molecule can produce two double-stranded copies in a complete amplification cycle. A standard-curve calculation may return a higher number, but the underlying geometric amplification cannot genuinely pass that limit.
Can PCR Efficiency Actually Be Higher Than 100%?
No, true PCR amplification efficiency cannot exceed 100% under the standard model of DNA replication. Each original double-stranded target can produce no more than two complete copies in one cycle.
A reported efficiency above 100% does not mean the polymerase has copied each target more than once during the same extension step. It means the measured Cq values created a standard-curve slope that mathematically corresponds to an apparent efficiency above 100%.
qPCR software does not observe every target molecule directly. It measures fluorescence, assigns Cq values, fits a regression line, and estimates efficiency from the slope. Errors anywhere in that chain can make the result look biologically impossible.
A slope shallower than −3.32 produces a calculated value above 100%. Such a slope may imply efficiency above 100%, even though geometric amplification cannot truly exceed that level.
How Is PCR Efficiency Calculated?
PCR efficiency is commonly calculated from a standard curve prepared with serial dilutions of a known template. The Cq value for each dilution is plotted against the base-10 logarithm of its starting quantity.
The formula is:
Efficiency = [10^(−1/slope) − 1] × 100
Here, the slope comes from the regression line formed by the dilution-series data.
A slope of approximately −3.32 represents 100% efficiency because a tenfold change in starting template should produce a Cq difference of about 3.32 cycles.
Prepare several serial dilutions, plot Cq against the dilution factor, fit a straight line, and confirm that the coefficient of determination is at least 0.99. A slope of −3.32 indicates 100% amplification efficiency.
PCR Efficiency Examples by Standard-Curve Slope
The relationship between slope and calculated efficiency looks like this:
| Standard-curve slope | Approximate efficiency | Interpretation |
| −3.10 | 110% | Upper edge of a commonly used range |
| −3.20 | 105% | Slightly above ideal |
| −3.32 | 100% | Ideal theoretical efficiency |
| −3.44 | 95% | Usually acceptable |
| −3.58 | 90% | Lower edge of a common working range |
| −3.80 | 83% | Low efficiency |
| −2.90 | 121% | Likely technical or analytical problem |
A standard curve with a slope of −3.0, for example, gives:
Efficiency = [10^(−1/−3.0) − 1] × 100
Efficiency = [10^0.333 − 1] × 100
Efficiency ≈ 115.4%
The software may calculate 115.4%, but the number should not be interpreted as real super-doubling. It should prompt a review of the assay and standard curve.
Is 105% PCR Efficiency Acceptable?
An efficiency of 105% is often treated as acceptable when the amplification curves, specificity checks, replicate agreement, and standard-curve linearity are strong. Many laboratories use a working range of 90% to 110%, corresponding roughly to slopes between −3.58 and −3.10.
Research discussing qPCR assay performance commonly cites −3.32 as ideal and 90% to 110% as a typical working interval.
Still, 105% should not receive automatic approval based only on the percentage.
Check whether:
- Replicate Cq values are close together.
- The dilution series was prepared accurately.
- The standard curve has strong linearity.
- The amplification plots have consistent shapes.
- The melt curve shows one expected peak in a dye-based assay.
- No-template controls remain negative.
- The lowest template levels are still within the assay’s quantitative range.
A clean 105% result may reflect normal experimental uncertainty. A 105% result accompanied by scattered replicates, extra melt peaks, or curved standard-curve data is less trustworthy.
Why Does PCR Efficiency Appear Higher Than 100%?
Apparent efficiency above 100% usually develops because the observed Cq spacing between dilution points is smaller than expected. Several experimental and analytical problems can compress that spacing.
Inaccurate Serial Dilutions Can Produce Inflated Efficiency
Dilution error is one of the most common reasons for an efficiency result above 100%. The standard-curve formula assumes that each dilution contains exactly the stated amount of target.
Suppose a tenfold dilution was intended, but the actual concentration changed only sevenfold because of pipetting or mixing error. The Cq difference between those two standards will be smaller than the expected 3.32 cycles. The regression line becomes shallower, and the calculated efficiency rises.
Small errors can accumulate across a multistep dilution series. A mistake in the first tube affects every tube prepared from it.
Common dilution problems include:
- Pipetting a volume near the lower limit of the pipette
- Failing to mix each dilution before transferring to the next tube
- Using a poorly calibrated pipette
- Leaving droplets on the tube wall or pipette tip
- Preparing too many sequential dilutions from one previous tube
- Losing DNA through adsorption to plastic at very low concentrations
Pipette precision, pipette calibration, and poor mixing are the frequent causes of misleading standard-curve slopes.
A safer approach is to prepare enough volume for all replicates, mix every dilution thoroughly, and use pipetting volumes that fall comfortably within the instrument’s reliable range.
PCR Inhibitors Can Distort the Standard Curve
An inhibitor may be more concentrated in the least diluted samples and progressively weaker in the more diluted standards. This creates a misleading pattern.
The concentrated samples amplify later than expected because inhibition delays their Cq values. The diluted samples may amplify more normally because dilution lowers the inhibitor concentration.
The result is compressed Cq spacing and a shallower standard-curve slope. The software may then report efficiency above 100%.
Possible inhibitors include:
- Phenol carried over from extraction
- Ethanol or wash buffer residue
- Guanidinium salts
- Hemoglobin
- Heparin
- Humic acids
- Polysaccharides
- High salt concentrations
- Excess input DNA
Components carried over from reverse transcription
The inhibitor is not making amplification more efficient. It is suppressing the concentrated points more strongly than the diluted points.
This pattern is sometimes called relief of inhibition by dilution. A sample that performs better after dilution may contain enough inhibitor to disturb quantification.
Nonspecific Amplification Can Raise the Apparent Efficiency
Dye-based qPCR chemistries detect double-stranded DNA rather than only the intended target. Primer dimers and off-target amplicons can add fluorescence to the reaction.
If nonspecific products form unevenly across the dilution series, the Cq values may no longer reflect the true target concentration. Low-template reactions are particularly vulnerable because primer dimers can represent a larger share of the total fluorescence.
The calculated efficiency may rise above 100% even when the intended target is amplifying poorly.
Review the melt curve for:
- More than one peak
- A shoulder beside the main peak
- A broad peak
- A low-temperature peak consistent with primer dimers
- Peak temperatures that vary between dilutions
Agarose gel electrophoresis can add another layer of confirmation. One band at the expected size supports specificity, while multiple bands suggest that the fluorescence signal includes unwanted products.
Probe-based assays offer greater sequence specificity, but they are not completely protected from poor assay design or off-target amplification.
Threshold and Baseline Settings Can Change the Result
The Cq value depends on how the software handles baseline fluorescence and where it places the threshold. Poor settings can move some Cq values more than others.
The threshold should cross the exponential region of the amplification curves. A threshold placed too low may intersect baseline noise. One placed too high may reach curves after their efficiencies have started to decline.
Automatic analysis settings are convenient, but they do not always treat unusual curves correctly. Reanalyse the plate with one consistent threshold when comparing standards from the same assay.
Look at the raw amplification plots rather than trusting the final efficiency value alone. Smooth, parallel curves usually tell a more convincing story than a percentage shown in a report.
Low-Copy Standards Can Make the Curve Unstable
The lowest standard concentrations often contain very few target molecules. At that level, random sampling becomes a major source of variation.
One well may receive several target copies, while another may receive one or none. Replicate Cq values spread apart, and occasional amplification failures become more likely.
These points can pull the regression line away from its true slope. A strong R² value does not always reveal the full problem because a curve can remain visually linear while one or two low-copy points alter the slope.
Remove a point only when there is a clear scientific reason, such as:
- The concentration falls below the stated quantitative range.
- Replicates show poor agreement.
- Some wells fail to amplify.
- The point breaks the dilution pattern.
- Contamination or dispensing error is documented.
Do not remove points simply to obtain a preferred efficiency value. Report the tested range and explain any exclusions.
Reverse Transcription Can Add Variation to RT-qPCR Efficiency
RT-qPCR includes a reverse-transcription step before amplification. Variation in RNA quality, priming, enzyme activity, or cDNA synthesis can influence the apparent assay response.
A standard curve made by diluting RNA before reverse transcription measures combined RT and PCR behavior. A curve made by diluting finished cDNA mainly tests the qPCR stage.
These two designs answer different questions.
When gene-expression measurements are the goal, prepare standards in a way that resembles the unknown samples. Keep RNA input, reverse-transcription chemistry, and dilution matrix consistent wherever possible.
Genomic DNA contamination can also alter results when primers can amplify both cDNA and genomic sequences. Include no-reverse-transcription controls when that risk exists.
Contamination Can Compress Cq Differences
Carryover contamination adds target molecules to wells that should contain less template. The effect is often most visible in the lower standards because even a small amount of contaminating DNA represents a large fraction of their expected target quantity.
A contaminated low standard may amplify too early. This reduces the Cq difference between dilution points and raises the calculated efficiency.
Check the no-template control, but remember that contamination may affect only certain wells. Review whether the low standards have unexpectedly early Cq values or poor replicate agreement.
Use separate areas for reaction setup and amplified product handling. Filter tips, fresh aliquots, clean work surfaces, and unidirectional movement through the laboratory reduce carryover risk.
A High R² Does Not Prove the Efficiency Is Correct
R² describes how closely the data points follow a straight line. It does not prove that the dilution concentrations are accurate, the assay is specific, or the slope is biologically credible.
A standard curve can have an R² of 0.99 or higher and still produce 115% efficiency. Every dilution point may be consistently wrong in a way that preserves linearity.
For example, systematic inhibition in the concentrated samples can create a smooth line with a shallow slope. The regression looks strong, but the efficiency remains misleading.
Judge a standard curve through several features together:
- Slope
- Efficiency
- R²
- Replicate spread
- Cq spacing
- Amplification-curve shape
- Melt-curve profile
- Control results
- Tested concentration range
The original MIQE guidelines were created to support reliable qPCR reporting and call for clear documentation of assay performance, including calibration-curve slope, efficiency, linear range, and specificity.
How Much PCR Efficiency Is Too High?
A result between 100% and 110% may be workable when all other assay checks are strong. Values above 110% deserve closer examination, while repeated results around 115% or higher usually point to a meaningful problem.
A practical interpretation is:
90% to 110%
This range is commonly used for well-performing qPCR assays. Results near either boundary still need support from clean plots, close replicates, and specific products.
110% to 115%
This range is questionable. Recheck dilution preparation, inhibitors, threshold placement, and low-copy points before using the assay for quantitative comparisons.
Above 115%
This level is rarely credible as an acceptable standard-curve result. Repeat the curve with fresh dilutions and review the assay design.
Extremely High Values
Efficiency values such as 130%, 150%, or 200% usually reflect a major dilution, calculation, data-entry, specificity, or analysis error. They should not be used for routine quantification without finding and correcting the source.
How Do You Fix PCR Efficiency Above 100%?
Start with the standard curve because apparent efficiencies above 100% are often produced there rather than by the core chemistry.
Prepare a Fresh Dilution Series
Use a fresh stock and prepare new standards with adequate total volume. Mix every tube well before transferring material.
Choose a dilution factor that gives clear Cq separation while keeping all points inside the assay’s reliable range. Fivefold or tenfold series are common, though the best choice depends on the expected concentration range.
Recommended is, at least five serial dilutions and an R² of 0.99 or higher when efficiency is estimated through a standard curve.
Test for Inhibition
Run the suspected sample undiluted and at several dilution levels. Compare the observed Cq movement with the expected change.
For a tenfold dilution, a well-behaved assay near 100% efficiency should show a Cq increase close to 3.32 cycles. A much smaller increase may suggest that dilution relieved inhibition.
Clean the nucleic acid again, lower the input amount, or use a chemistry that tolerates the sample matrix better.
Check Primer Specificity
Review primer sequences, expected amplicon size, annealing temperature, and target uniqueness.
For dye-based assays, inspect melt curves and run representative products on a gel. Redesign the primers when unwanted products remain after reasonable changes to reaction conditions.
Review the Amplification Plots
Check that every standard displays a smooth sigmoidal curve and that replicate curves cluster closely.
Set one threshold across the standard series within the exponential region. Avoid thresholds that cut through baseline noise or the late nonlinear phase.
Repeat Weak Low-Concentration Points
Increase the number of replicates near the lower end of the range. Remove concentrations that fall below the assay’s reliable quantitative limit from the curve, with the reason recorded.
A narrower but dependable range is more useful than a wide range containing unstable points.
Confirm Pipette Performance
Check calibration, tip fit, dispensing technique, and the chosen volume range. Use a smaller-capacity pipette for small volumes rather than operating near the bottom of a large pipette’s range.
Reverse pipetting or an electronic pipette may help with viscous solutions and repeated dispensing.
Include the Right Controls
Run no-template controls, no-reverse-transcription controls for RNA work, a known positive control, and extraction controls where relevant.
Controls help separate contamination, genomic DNA carryover, extraction failure, and reaction inhibition.
Can You Use Results From an Assay With Efficiency Above 100%?
Results near 100%, such as 102% or 105%, may be usable when the assay has strong specificity, close replicates, a suitable linear range, and repeatable performance.
An assay reporting 112% or 118% should usually be corrected before it is used for precise relative expression or copy-number calculations. Efficiency errors are magnified across many amplification cycles and can produce misleading fold changes.
This matters even more when comparing a target gene with a reference gene. If the two assays behave differently, a standard 2^−ΔΔCq calculation may introduce bias because that method assumes similar, near-perfect amplification behavior.
According to many experts efficiency assumptions can produce large differences in calculated quantities over many cycles. The apparent convenience of a single percentage should not replace inspection of the original amplification data.
What Should Be Reported With PCR Efficiency?
A reported efficiency percentage is more useful when readers can see how it was obtained.
Include:
- The standard-curve slope
- Calculated efficiency
- R² value
- Number of dilution points
- Dilution factor
- Number of replicates
- Template type
- Concentration range
- Cq range
- Threshold method
- Primer and probe sequences where appropriate
- Product-specificity checks
- Any removed points and the reason for removal
These details allow another researcher to judge whether a value such as 106% reflects normal experimental variation or an unresolved assay problem.
PCR Efficiency Above 100% Is a Warning From the Data
PCR efficiency can be calculated at more than 100%, but the reaction is not truly producing more than two copies from each target molecule per cycle. The elevated number usually comes from a shallow standard-curve slope caused by dilution errors, inhibition patterns, nonspecific products, unstable low-copy standards, contamination, or analysis settings.
A result slightly above 100% may still support useful measurements when every other quality check is strong. Larger or repeated departures deserve attention before the data are used to draw biological conclusions.
Treat the efficiency value as one part of the assay story, not a pass-or-fail score on its own. The amplification plots, dilution behavior, specificity, controls, and repeatability reveal whether the numbers deserve confidence.