Why Do PCR Amplification Curves Look Jagged?
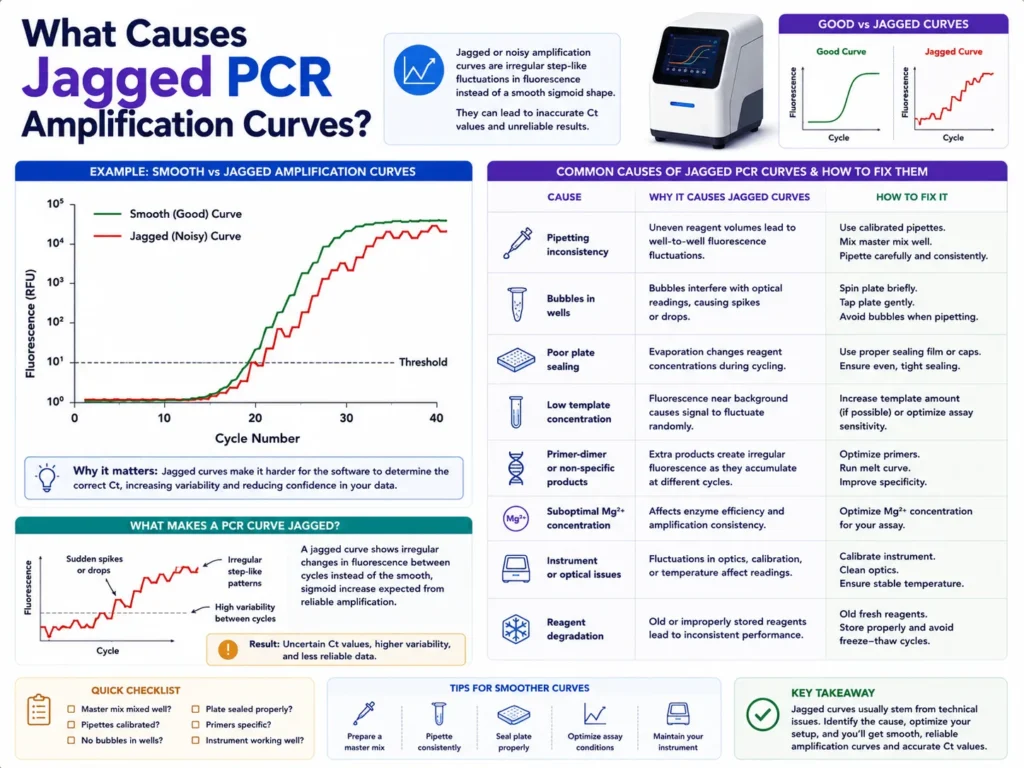
Jagged PCR amplification curves usually appear when fluorescence readings fluctuate from one cycle to the next instead of forming a smooth, rising S-shaped line. Air bubbles, poor plate sealing, evaporation, inconsistent pipetting, optical interference, weak fluorescence, low template levels, reaction inhibitors, and incorrect baseline settings are among the most common causes.
A rough-looking curve does not always mean the PCR reaction itself has failed. Sometimes DNA amplification is progressing normally, but the instrument cannot read the fluorescent signal consistently. In other cases, the irregular shape points to a true reaction problem that may affect the Cq value and make quantification unreliable.
The fastest way to find the cause is to compare raw fluorescence data, replicate wells, controls, melt curves, and the physical location of affected wells. The pattern usually reveals whether the problem came from plate preparation, sample quality, assay design, data analysis, or the real-time PCR instrument.
What does a jagged PCR amplification curve look like?
A jagged PCR amplification curve contains small spikes, dips, steps, or repeated up-and-down movements across the amplification plot. Instead of rising smoothly through the exponential phase, the fluorescence signal looks noisy or uneven.
A normal qPCR curve usually begins with a relatively flat baseline. It then enters an exponential phase, where the target product increases rapidly, before bending toward a plateau as reaction components become limited.
Jagged curves break that smooth pattern. The irregular movement may occur during the baseline, exponential rise, plateau, or across the entire run.
Some curves show only minor roughness. These may still produce usable Cq values when replicate agreement and assay performance remain strong. Other curves jump sharply between cycles, cross the threshold more than once, or produce large differences between replicate wells. Those results need closer inspection before they are used for gene expression, copy-number, pathogen, or diagnostic research calculations.
Why do fluorescence readings become jagged?
Jagged fluorescence readings develop when the optical signal changes unevenly between cycles. The source may be physical, chemical, biological, or computational.
Real-time PCR instruments measure fluorescence after selected cycle steps. That fluorescence may come from a DNA-binding dye such as SYBR Green or from a sequence-specific hydrolysis probe. The graph is built from the signal recorded during each cycle. qPCR differs from endpoint PCR because amplification is followed during the reaction rather than checked only after the final cycle.
Anything that interrupts light transmission, changes reaction volume, produces unstable fluorescence, or causes inconsistent DNA amplification can create a rough plot.
The curve itself is only the visible symptom. Finding the real cause requires looking at where the irregularity begins and which wells share the same pattern.
Air bubbles are one of the most common causes
Air bubbles can block or scatter light as the instrument reads fluorescence through the reaction vessel. A bubble may also move as the plate heats and cools, causing the signal to rise or fall suddenly between cycles.
This often creates sharp spikes or isolated dips rather than a consistently weak curve. One well may look jagged while surrounding wells remain normal.
Bubbles commonly enter wells during fast pipetting, incomplete dispensing, repeated mixing, or plate sealing. Small droplets left on the side of a well can create similar reading problems.
Many qPCR protocols recommend briefly centrifuging the prepared plate before the run. This brings the reaction mixture to the bottom of each well and removes visible bubbles. Some plate instructions specify centrifugation near 1,000 to 1,500 × g for about one minute, though the correct setting depends on the plate, instrument, and assay instructions.
Inspect the underside of the plate before loading it. Every well should contain a single, level reaction volume without visible bubbles or liquid trapped high on the walls.
Poor plate sealing can cause evaporation and signal instability
An incomplete seal allows water to escape while the plate is exposed to repeated heating cycles. The reaction becomes more concentrated, and fluorescence may change unpredictably.
Evaporation often affects edge wells more strongly because they are more exposed to temperature differences and imperfect sealing. Affected wells may show jagged curves, unusual endpoint fluorescence, delayed amplification, or Cq values that differ from central wells.
The plate seal must be compatible with the real-time PCR instrument. Standard adhesive film may not have the same optical clarity, heat resistance, or sealing strength as an optical qPCR film.
Press the seal firmly across the full plate surface, including the edges and spaces between wells. A roller or sealing tool usually gives more even pressure than fingers alone.
For tube strips, each cap needs to close fully. A cap that looks secure may still leave a small gap. Poor tube closure has been linked with reaction evaporation and invalid amplification results in PCR troubleshooting instructions.
Inconsistent pipetting can make replicate curves look rough
Small pipetting errors change the amount of template, primers, probe, master mix, or water added to each reaction. The result may appear as uneven replicate curves, different Cq values, variable curve heights, or irregular amplification slopes.
Low-volume reactions are especially sensitive. An error of one microlitre represents 5% of a 20 µL reaction, but 10% of a 10 µL reaction. The same dispensing error becomes more serious as total reaction volume falls.
Jaggedness may also occur within a single well when reagents are not mixed evenly. A concentrated pocket of dye, template, salt, or enzyme may redistribute as the reaction heats.
Prepare enough master mix for all reactions plus a small excess for pipetting loss. Mix gently but fully, then briefly centrifuge the tube before dispensing. Avoid transferring foam into the plate.
A multichannel pipette should be checked when the problem repeats in the same plate columns. One damaged or poorly fitted channel can produce a recognizable positional pattern.
Very low template levels create noisy late amplification
Reactions near the assay’s detection limit often produce weak and inconsistent fluorescence. At very low target concentration, random differences in the number of molecules added to each well become much more visible.
One replicate may receive several target copies, another may receive one, and a third may receive none. The resulting curves can cross the threshold at widely different cycles or develop rough shapes late in the run.
Late-cycle amplification also occurs when background fluorescence and instrument noise account for a larger share of the total signal. A small change in fluorescence can look large when the true amplicon signal is weak.
Low-input samples should not be judged from curve smoothness alone. Check replicate consistency, negative controls, positive controls, amplification efficiency, and melt-curve specificity.
Adding more template may help, but only when the sample does not contain inhibitors. Concentrating a dirty sample can make the reaction worse.
Too much template can also distort amplification curves
High template input can produce very early amplification that overlaps with the baseline cycles selected by the software. The program may then subtract part of the true amplification signal as background.
This can create strange bends, dips, flattened early curves, or rough normalized plots even when the raw fluorescence data look more reasonable.
Excess template may also introduce high levels of salts, extraction chemicals, proteins, or other substances that interfere with the polymerase. The combined effect can produce early signal followed by weak or unstable amplification.
Run a dilution series when template overload is suspected. A 1:5 or 1:10 dilution may produce a cleaner curve and a predictable Cq delay. Better amplification after dilution often points to inhibition or excessive sample input.
The raw, uncorrected fluorescence plot is especially useful here. When the raw signal looks smooth but the baseline-corrected graph appears jagged, the main problem may lie in the software settings rather than the reaction.
PCR inhibitors can cause uneven amplification
PCR inhibitors reduce polymerase activity, interfere with primer binding, alter magnesium availability, or affect fluorescence chemistry. Their effect may vary across cycles, creating shallow, delayed, irregular, or poorly reproducible curves.
Common inhibitors include:
- Ethanol carried over from wash steps
- Phenol or guanidinium compounds from extraction
- Hemoglobin and heme from blood samples
- Heparin from certain blood collection tubes
- Melanin from tissue samples
- Polysaccharides and polyphenols from plants
- High salt concentrations
- Excess EDTA
- Proteins, detergents, or organic solvents
Sample impurities can also affect internal or positive PCR controls. Large control Cq differences between samples may indicate that inhibition is present rather than a true change in target concentration.
A simple dilution test is often revealing. Diluting the nucleic acid reduces both the target and the inhibitor. When the diluted sample amplifies more smoothly or performs better than expected from the dilution factor, inhibition is likely.
Further cleanup, a different extraction method, or a smaller sample input may be needed.
Degraded reagents may produce weak or unstable fluorescence
Old or poorly stored master mix, primers and probes, dyes, or enzymes can lose activity. Repeated freeze-thaw cycles are a common source of gradual reagent damage.
Probe-based assays are sensitive to probe degradation because fluorescence depends on the condition and correct cleavage of the reporter-labeled probe. Light exposure may also damage some fluorescent dyes.
A degraded passive reference dye can affect normalized fluorescence when the software divides reporter signal by reference signal. The resulting amplification plot may look noisier than the raw reporter data.
Compare the questionable run with a known positive control prepared from fresh reagents. When both unknown samples and controls show the same rough pattern, reagent quality becomes more likely.
Store reagents within the recommended temperature range, protect light-sensitive components, and divide frequently used materials into smaller aliquots. Reaction mixes that have passed their expiry date or experienced uncertain storage conditions should be replaced.
Incorrect primer concentration can produce irregular amplification
Primer concentration affects how efficiently and specifically the target is copied. Too little primer may produce weak fluorescence and slow amplification. Too much primer may support primer-dimer formation or nonspecific products.
These unwanted products are especially relevant in SYBR Green assays because the dye binds to any double-stranded DNA, not only the intended amplicon. Nonspecific products can contribute fluorescence and create misleading amplification signals.
Poor primer design may also lead to variable performance. Strong secondary structures, primer complementarity, unsuitable melting temperatures, or binding-site variation can reduce amplification consistency.
The melt curve helps separate optical noise from product-related problems. A single sharp peak near the expected melting temperature supports one dominant product. Multiple peaks, broad peaks, or low-temperature peaks suggest nonspecific amplification or primer-dimers.
Agarose gel electrophoresis can provide further confirmation when the melt curve remains unclear.
An unsuitable annealing temperature can make curves unstable
An annealing temperature that is too low may allow primers to bind nonspecifically. A temperature that is too high may prevent consistent primer binding to the intended target.
Both conditions can reduce amplification efficiency and cause differences between replicates. The curves may rise slowly, develop uneven slopes, or remain close to the noise level.
A temperature-gradient run is one of the better ways to test this cause. Run the same template and reaction mixture across several annealing temperatures, then compare curve shape, Cq consistency, melt peaks, and amplification efficiency.
The best temperature is not always the one that gives the earliest Cq. A slightly later but cleaner and more reproducible signal may be more trustworthy.
Primer redesign may be needed when no temperature produces a specific, efficient reaction. Common assay-development advice includes testing primer concentration, adjusting annealing temperature, and selecting a different target region when irregular curves persist.
Weak probe or dye fluorescence can make normal variation look severe
A low fluorescent signal leaves less distance between the true amplification response and background noise. Minor reading changes then become highly visible on the plot.
Weak fluorescence may result from a degraded probe, low probe concentration, an unsuitable reporter dye, poor dye calibration, incorrect channel selection, or low amplicon yield.
Check whether the expected reporter channel was selected in the run setup. A FAM-labeled assay read through the wrong filter cannot produce dependable results.
Multiplex reactions require additional care because fluorophores may have overlapping emission ranges. Poor spectral compensation or an unsuitable dye combination can cause one target’s signal to interfere with another.
A singleplex test can show whether jaggedness comes from multiplex competition or channel interaction, while the instrument’s multicomponent plot can reveal excessive noise or unusual behavior in individual dye channels.
Baseline settings can create artificial jagged curves
The baseline represents fluorescence recorded before detectable amplification. The software uses these early cycles to estimate background and subtract it from later readings.
When the baseline includes cycles where true amplification has already started, part of the real signal may be treated as noise. The corrected plot may then show dips, hooks, uneven rises, or negative values.
The opposite problem occurs when too few suitable baseline cycles are selected. Background estimation becomes unstable, making the corrected signal look rough.
Baseline guidance commonly recommends ending the baseline a few cycles before the earliest visible amplification rather than allowing it to overlap with the exponential phase.
Automatic analysis works well for many routine runs, but it can struggle with very early amplification, weak late signals, high background, or mixed assays on the same plate.
Compare the following views:
- Raw fluorescence
- Baseline-corrected fluorescence
- Linear amplification view
- Log amplification view
- Individual wells rather than grouped wells
A smooth raw curve paired with a jagged corrected curve points strongly toward an analysis-setting problem.
A poorly placed threshold can make Cq values unreliable
The threshold should cross amplification curves within the exponential phase, above baseline noise and below the region where amplification begins to slow.
A threshold placed too low may cross random baseline fluctuations. The software may report false or unstable Cq values.
A threshold placed too high may intersect irregular portions of the curve near the plateau. Small fluorescence differences can then create large Cq changes between replicates.
Keep the threshold consistent across samples that need direct comparison, provided they use the same assay and run conditions. Moving the threshold separately for individual wells may hide poor assay performance rather than correct it.
The standard curve offers another check. qPCR standard curves use Cq values from known template dilutions to examine the relationship between starting quantity and amplification. Poor linearity or an unusual slope can reveal assay or threshold problems that are not obvious from one sample alone.
Condensation or droplets may interfere with optical readings
Condensation can form on the underside of caps or sealing film during thermal cycling. If droplets move through the instrument’s optical path, fluorescence readings may change between cycles.
This problem is more likely when plates are loaded cold, reaction mixtures remain on the well walls, seals are loose, or the heated lid is not functioning correctly.
Bring plates and reagents to the temperature recommended by the protocol before the run. Briefly centrifuge the sealed plate so all liquid sits at the bottom.
Do not open the plate after centrifugation unless absolutely necessary. Reopening can introduce bubbles, weaken the seal, and raise contamination risk.
Dirty plates and optical surfaces can create positional noise
Dust, fingerprints, adhesive residue, scratches, or liquid on the plate surface can interfere with light passing between the reaction and detector.
A fingerprint across several wells may create a cluster of abnormal curves. Scratches or cloudy sealing film may affect individual wells or rows.
Handle optical plates by their edges. Keep the underside clean and dry. Avoid writing on areas used for fluorescence reading.
Instrument optics may also need cleaning, calibration, or service. When the same physical well positions produce jagged signals across several unrelated runs, an instrument or block-related issue becomes more likely.
Run a calibration or uniformity plate according to the manufacturer’s instructions. Persistent position-based errors should be reviewed by qualified service staff.
Temperature nonuniformity can affect specific plate regions
Real-time PCR depends on accurate, repeatable heating and cooling. A thermal block that heats unevenly may cause differences in denaturation, annealing, extension, and fluorescence between wells.
Edge effects, damaged block contact points, warped plates, or incorrect consumables can prevent consistent thermal transfer.
A plate designed for one instrument may fit another block poorly even when the general dimensions appear similar. The wrong skirt, plate height, tube shape, or optical cap can change both thermal contact and fluorescence reading.
Map the affected wells. When jagged curves repeatedly appear in one row, column, corner, or block section, plate fit or instrument uniformity deserves attention.
Does a jagged curve always mean the result is unusable?
No. Minor roughness does not automatically make a qPCR result invalid. The result may still be usable when controls behave correctly, replicates agree closely, the curve crosses the threshold cleanly during exponential amplification, and product specificity is confirmed.
The level of concern depends on where the noise occurs.
Roughness limited to the plateau often has less effect on Cq because quantification takes place earlier. Noise around the threshold is more serious because it can change the reported Cq.
A curve should be treated cautiously when it has several of these features:
- Large replicate Cq differences
- Multiple threshold crossings
- A signal close to the baseline
- Amplification in the no-template control
- An abnormal melt profile
- A low or inconsistent endpoint signal
- Late amplification near the final cycles
- A poor standard-curve fit
- Strong dependence on manual baseline changes
Results used in regulated, clinical, or high-stakes settings must follow the acceptance rules of the validated assay. A curve that appears acceptable by eye may still fail the laboratory’s stated quality limits.
How can you tell whether the problem is optical or chemical?
Start with the raw fluorescence plot. Optical problems often create sudden spikes or dips, while reaction problems more often change the slope, timing, or strength of amplification.
Then compare replicate wells.
One isolated jagged well usually points toward a bubble, sealing defect, dispensing problem, or local optical obstruction. Jagged curves across the entire plate are more consistent with reagent, software, instrument, or cycling-program problems.
A pattern restricted to one sample may indicate poor sample quality or inhibition. A pattern restricted to one assay may indicate primer or probe trouble.
The melt curve provides another clue in dye-based reactions. A clean melt peak paired with a noisy amplification plot may support an optical or analysis issue. Multiple melt peaks support nonspecific product formation.
How should jagged qPCR curves be troubleshot step by step?
Begin with the easiest checks before changing the assay chemistry.
1. Inspect raw fluorescence
Determine whether the jagged shape is already present in the unprocessed data. Smooth raw data suggests that baseline correction or normalization created the pattern.
2. Check the physical wells
Look for bubbles, low volume, condensation, loose caps, damaged film, or liquid on the plate surface.
3. Map the affected positions
Record whether the problem occurs randomly or follows a row, column, edge, or block area.
4. Compare technical replicates
One abnormal replicate among several good wells often points toward plate preparation. All replicates behaving badly suggests a sample or assay problem.
5. Review controls
Check the no-template control, positive control, extraction control, reverse-transcription control, and internal amplification control where applicable.
6. Examine melt curves
Look for one expected peak, extra products, primer-dimers, or inconsistent melting temperatures.
7. Review baseline and threshold placement
Confirm that baseline cycles end before amplification begins and that the threshold crosses the exponential region.
8. Test a template dilution
Improved amplification after dilution supports inhibition or excessive template input.
9. Repeat with fresh reagents
Use a fresh aliquot of master mix, primers, probe, and control template. This separates reagent damage from sample-specific trouble.
10. Check instrument performance
When positional patterns persist, review dye calibration, thermal uniformity, optical status, maintenance history, and plate compatibility.
How can jagged amplification curves be prevented?
Consistent preparation has a larger effect than repeatedly adjusting the analysis after a poor run.
Use calibrated pipettes and compatible low-retention tips. Prepare one mixed master mix for all comparable reactions. Dispense slowly enough to avoid bubbles, then seal and centrifuge the plate before loading it.
Keep reaction volumes equal. Use clean optical plates and seals made for the instrument. Protect probes and fluorescent reagents from unnecessary light exposure.
Limit reagent freeze-thaw cycles. Store nucleic acids and assay components under their stated conditions. Include controls on every plate, and use technical replicates when sample quantity allows.
Document baseline, threshold, cycling, plate type, reagent lot, and instrument settings. Good records make recurring patterns easier to find.
Most jagged PCR amplification curves can be traced to a small set of causes: unstable optical readings, uneven reaction preparation, weak template signal, sample inhibition, assay-specific amplification problems, or unsuitable analysis settings. The graph becomes far easier to read once raw data, physical wells, controls, melt curves, and plate position are examined together. A clean repeat run should come from correcting the source of the noise, not merely smoothing the graph or moving the threshold until the result looks acceptable.