How is gene expression measured with PCR?
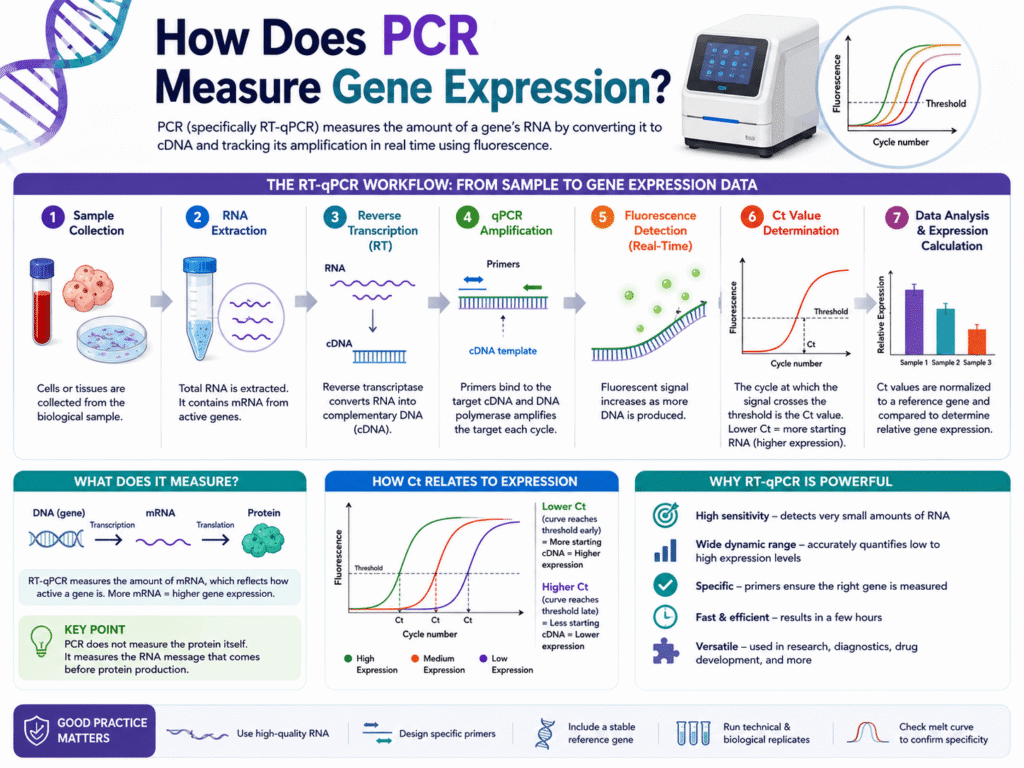
PCR measures gene expression by first turning RNA into complementary DNA, then tracking how much of that DNA builds up during amplification. The method most often used is called reverse transcription quantitative PCR, or RT-qPCR. It checks how active a gene is by measuring how much messenger RNA, or mRNA, was present in the original sample.
Genes do not “speak” directly, they send messages through RNA. If a cell is making a lot of RNA from a gene, that gene is usually more active. If there is little RNA, the gene is less active or quiet.
PCR does not measure the protein itself. It measures the RNA message that comes before protein production. That is why RT-qPCR has become one of the most trusted lab methods for comparing gene activity between healthy tissue, diseased tissue, treated cells, untreated cells, or different time points in an experiment. qPCR links DNA amplification with real-time fluorescence, allowing researchers to estimate the starting amount of target material from the reaction curve.
What Does Gene Expression Mean in PCR?
Gene expression means how much a gene is being used by a cell to make RNA. PCR measures this activity through the amount of RNA linked to that gene.
A gene is like a stored instruction. The cell does not use every instruction at the same time. Some genes are active in liver cells, others in nerve cells, immune cells, cancer cells, or stressed cells.
When a gene is active, the cell copies part of its DNA code into messenger RNA. That mRNA can later guide protein production. RT-qPCR looks for that RNA signal.
PCR measures gene expression indirectly. It does not watch the gene turning on inside the chromosome. It measures the RNA copy made from that gene.
This is still very useful. RNA levels often tell researchers whether a biological pathway is active, whether a treatment changed cell behavior, or whether a disease marker is present.
Why Regular PCR Alone Is Not Enough for Gene Expression
Regular PCR can show whether a DNA target is present, but it is not the best method for measuring gene expression levels. Gene expression needs quantity, not just presence or absence.
Traditional PCR is usually checked at the end of the reaction. At that stage, the reaction may already be saturated. Two samples that started with very different amounts of RNA can look similar after many cycles because both reactions may have reached a plateau.
RT-qPCR solves this problem by measuring the signal during the early, cleaner part of amplification. The machine records fluorescence after each PCR cycle. The earlier the signal rises above background, the more starting material was present.
That early signal is the key. A sample with more starting cDNA reaches the detection threshold sooner. A sample with less starting cDNA reaches it later.
What Is RT-qPCR?
RT-qPCR stands for reverse transcription quantitative polymerase chain reaction. It is the main PCR-based method used to measure gene expression.
The “RT” part means reverse transcription. RNA is copied into complementary DNA, also called cDNA. The “qPCR” part means quantitative PCR, where amplification is tracked in real time using fluorescence.
The naming can be confusing. RT-PCR can mean reverse transcription PCR, while qPCR means quantitative PCR. RT-qPCR combines both steps and is widely used for RNA-based gene expression analysis. Current PCR reporting guidance uses qPCR for quantitative real-time PCR and RT-qPCR for RNA measured after reverse transcription.
RT-qPCR is popular because it is sensitive, fast, and works well when researchers want to measure one gene or a focused group of genes. It is used in cancer biology, immunology, microbiology, plant science, toxicology, drug testing, and clinical research.
How Does PCR Measure Gene Expression Step by Step?
PCR measures gene expression through a chain of lab steps: RNA extraction, RNA conversion to cDNA, amplification, fluorescence reading, Ct value calculation, normalization, and comparison.
Each step affects the final answer. A weak RNA sample, poor primer design, or unstable reference gene can make the result misleading.
RNA Is First Taken From the Sample
The process begins with a biological sample. It may be blood, tissue, cultured cells, plant material, bacteria, or another source.
Researchers extract total RNA from the sample. This RNA pool contains many RNA molecules, including mRNA from active genes.
RNA quality is a big part of the result. RNA breaks down easily. Heat, enzymes, poor storage, repeated freezing, and rough handling can damage it.
A clean RNA sample gives a clearer gene expression reading. A degraded sample may make a gene look less active than it really was.
RNA Is Converted Into cDNA
PCR enzymes amplify DNA, not RNA. So the RNA must first be copied into complementary DNA.
This happens through reverse transcription. An enzyme called reverse transcriptase reads RNA and builds a matching DNA copy.
That cDNA becomes the template for qPCR.
The amount of cDNA made should reflect the amount of RNA in the sample. If a gene had a lot of mRNA, more matching cDNA should be present. If the gene had little mRNA, less matching cDNA should be present.
Primers Select the Gene of Interest
PCR does not amplify every gene at once unless the assay is designed for many targets. In standard RT-qPCR, primers are made for one target gene.
Primers are short DNA pieces that bind to a specific region of the cDNA. They tell the PCR reaction what to copy.
Good primers are very specific. They should amplify the intended gene and avoid closely related sequences.
Poor primer design can create false signals. It may amplify the wrong target, primer-dimers, or contaminating DNA.
Fluorescence Tracks Amplification in Real Time
RT-qPCR uses fluorescent chemistry to monitor DNA buildup during each cycle.
As the target DNA copies increase, the fluorescent signal rises. The qPCR machine records this increase cycle after cycle.
There are two common signal systems:
SYBR Green binds to double-stranded DNA. It is simple and lower-cost, but it can also bind to unwanted double-stranded products.
TaqMan probes use a target-specific fluorescent probe. They are usually more specific because signal appears only when the probe binds and is cut during amplification.
In both cases, the machine creates an amplification curve. That curve is used to estimate how much target cDNA was present at the start.
What Is Ct Value in Gene Expression PCR?
Ct value, also called Cq value, is the PCR cycle number where fluorescence crosses a set detection threshold. A lower Ct usually means more starting target. A higher Ct usually means less starting target.
Ct stands for cycle threshold. Cq stands for quantification cycle. Many people still use Ct, though Cq is often used in reporting standards.
If a sample crosses the threshold at cycle 18, it had more starting target than a sample crossing at cycle 30, assuming the assays work with similar efficiency.
The Ct value is not a direct expression number by itself. It needs context. Researchers compare it against reference genes, control samples, and assay performance.
A Ct difference of one cycle often suggests about a two-fold difference when PCR efficiency is near 100%. The common ΔΔCt method is built around this idea, though it depends on similar amplification efficiency between target and reference reactions.
Why Lower Ct Means Higher Gene Expression
A lower Ct means the target signal appeared earlier. That usually means more target cDNA was present before PCR started.
Imagine two samples. Sample A has many cDNA copies from a highly active gene. Sample B has fewer copies because the gene is less active.
During PCR, both samples amplify. But Sample A reaches the fluorescence threshold sooner because it started with more target.
That is the reason lower Ct values are often linked with higher gene expression.
Still, Ct values should not be read alone. A raw Ct can be affected by RNA input amount, reverse transcription quality, pipetting differences, inhibitors, and reference gene choice. qPCR data analysis guidance warns that Cq values are linked to starting concentration, but correct interpretation needs the right analysis method and reporting detail.
What Is a Reference Gene in PCR Gene Expression?
A reference gene is a gene used as an internal control. It helps correct for differences in RNA amount, sample handling, and reaction setup.
People sometimes call reference genes housekeeping genes. Common examples include GAPDH, ACTB, 18S rRNA, and HPRT1, but no reference gene is stable in every tissue, disease state, or treatment.
That last point is where many weak experiments fail. A reference gene should be tested for the specific sample type and condition.
If the reference gene changes during the experiment, it can distort the result. A target gene may appear up or down only because the control gene moved.
Reliable RT-qPCR work depends on stable reference genes and careful control of technical variation.
How Does Normalization Work in RT-qPCR?
Normalization compares the target gene Ct against a reference gene Ct from the same sample. This reduces noise caused by sample-to-sample variation.
The most common first calculation is ΔCt.
ΔCt = Ct of target gene − Ct of reference gene
A smaller ΔCt usually means higher target gene expression relative to the reference gene. A larger ΔCt usually means lower expression.
After ΔCt is calculated for each sample, researchers compare treated samples against a control sample.
That gives ΔΔCt.
ΔΔCt = ΔCt of test sample − ΔCt of control sample
Then fold change is often calculated as:
2^-ΔΔCt
This gives a relative expression value. A result of 2 means the gene is about two times higher in the test sample than in the control. A result of 0.5 means it is about half as high.
The 2^-ΔΔCt method is one of the most widely used approaches for relative gene expression analysis, but it assumes that target and reference assays amplify with similar efficiency.
What Is Relative Gene Expression?
Relative gene expression tells how much a gene changed compared with another sample or condition. It does not give the exact number of RNA molecules.
Most RT-qPCR gene expression studies use relative expression.
A researcher may compare:
- Healthy tissue vs tumor tissue
- Untreated cells vs drug-treated cells
- Day 0 vs day 7
- Wild type cells vs edited cells
- Low-stress plants vs drought-stressed plants
The control sample is often called the calibrator. Every other sample is compared with it.
If the treated group shows a fold change of 4, the target gene expression is about four times higher than the control, assuming the assay and normalization are sound.
Relative quantification is widely used because it is practical. It does not require a standard curve for every target in every run, though assay efficiency still needs attention.
What Is Absolute Gene Expression?
Absolute gene expression estimates the actual number of target copies in a sample. It usually needs a standard curve made from known amounts of target material.
In absolute quantification, researchers prepare standards with known copy numbers. The qPCR machine reads those standards and builds a curve.
Unknown samples are then compared against that curve.
Absolute quantification can be useful when exact copy number matters, such as viral load, microbial load, plasmid copy number, or certain clinical assays.
For many gene expression studies, relative expression is enough. Researchers often care whether a gene increased, decreased, or stayed steady under a condition.
Absolute and relative qPCR methods answer different questions. Relative quantification compares change between samples, while absolute quantification estimates copy number through standards or related calibration methods.
How Does the PCR Machine Know How Much Gene Expression Is Present?
The PCR machine does not “see” gene expression directly. It sees fluorescence from amplified DNA. Software then converts the curve into Ct or Cq values.
The instrument measures light after every cycle. At first, the signal is low and close to background. As amplification continues, the signal rises.
The software places a threshold in the exponential phase of amplification. The cycle where each sample crosses that line becomes the Ct value.
Those Ct values are then used for calculations.
The machine gives the raw signal. The researcher gives the biological meaning through sample design, controls, reference genes, and proper analysis.
Why Reverse Transcription Quality Affects Gene Expression Results
Reverse transcription is one of the biggest sources of variation in RT-qPCR. If RNA is not copied into cDNA well, the final PCR signal may be low even when the original gene was active.
Several things can affect reverse transcription:
- RNA purity
- RNA integrity
- enzyme performance
- primer type used during cDNA synthesis
- reaction temperature
- inhibitors carried over from extraction
- sample storage
Two samples may contain the same amount of RNA, but if one reverse transcription reaction works poorly, that sample may show a higher Ct.
That is why many labs include no-reverse-transcription controls, technical replicates, and careful RNA quality checks.
What Controls Are Needed When PCR Measures Gene Expression?
PCR gene expression experiments need controls to tell real signal apart from noise, contamination, and technical error.
A no-template control checks for contamination in reagents. It contains PCR mix and primers but no sample cDNA.
A no-reverse-transcription control checks whether genomic DNA contamination is being amplified.
A positive control confirms that the assay can detect the target.
A reference gene control helps normalize sample variation.
A melt curve is often used with SYBR Green assays to check whether one clean product was amplified.
Good controls make the difference between a result that looks convincing and a result that can be trusted.
How Accurate Is PCR for Measuring Gene Expression?
RT-qPCR can be highly sensitive and reliable when the experiment is designed well. Poor design can make the numbers look precise while the biology is wrong.
Accuracy depends on RNA quality, primer specificity, PCR efficiency, reference gene stability, replicate quality, and data analysis.
The MIQE guidelines were created to improve qPCR reporting, consistency, and transparency. They ask researchers to report enough detail for readers to judge experiment quality, including sample handling, assay design, controls, and analysis choices.
PCR is powerful because it can detect very small amounts of starting material. That same sensitivity also means tiny errors can be amplified.
A small amount of contamination, degraded RNA, or a weak reference gene can change the answer.
Does PCR Measure mRNA or Protein?
PCR measures RNA-derived cDNA, not protein. In gene expression studies, RT-qPCR usually measures mRNA levels.
A gene can produce mRNA, but the final protein level may still depend on translation rate, protein stability, degradation, and cell state.
So, RT-qPCR is best read as a measure of transcript abundance. It tells how much RNA message is present for a gene.
If the research question is about protein amount, methods such as western blotting, ELISA, mass spectrometry, flow cytometry, or immunostaining may be needed.
PCR answers the RNA question. It does not fully answer the protein question.
Why Gene Expression PCR Results Are Often Shown as Fold Change
Fold change is easier to understand than raw Ct values. It tells how much gene expression changed compared with a control.
A fold change of 1 means no change.
A fold change above 1 means expression increased.
A fold change below 1 means expression decreased.
For example, a result of 3 means the gene expression is about three times higher than the control. A result of 0.25 means expression is about one-quarter of the control.
Fold change is common because it turns cycle numbers into a biological comparison.
Still, fold change should be paired with replicate data and statistics. A two-fold change from noisy samples may be less convincing than a smaller change measured cleanly across many biological replicates.
What Is PCR Efficiency and Why Does It Matter?
PCR efficiency describes how well the target doubles during each PCR cycle. Perfect doubling would be 100% efficiency, though real assays often vary.
The ΔΔCt method works best when target and reference genes amplify at close to the same efficiency.
If one assay amplifies faster than the other, the final fold change can be biased.
Researchers often test efficiency using a dilution series. A good assay produces a standard curve with consistent spacing between Ct values.
Many qPCR workflows check assay efficiency before trusting gene expression numbers. The standard curve approach is also used in qPCR quantification because Ct values can be plotted against known input amounts.
What Can Go Wrong When PCR Measures Gene Expression?
PCR gene expression data can look clean even when hidden problems exist. The most common issues are usually sample quality, assay design, and weak normalization.
RNA degradation can raise Ct values and make expression look lower.
Genomic DNA contamination can create signal that does not come from RNA.
Bad primers can amplify the wrong target.
Unstable reference genes can make a real change look small or make a stable gene look changed.
Low PCR efficiency can distort fold change.
Too few biological replicates can make random variation look meaningful.
Plate effects can appear when samples are placed poorly across wells.
These problems do not mean RT-qPCR is unreliable. They mean the method needs discipline. The chemistry is sensitive, so the setup must be careful.
How Is RT-qPCR Different From RNA-Seq for Gene Expression?
RT-qPCR measures selected genes with high sensitivity. RNA-seq measures thousands of genes across the transcriptome.
RT-qPCR is often used when researchers already know which genes they care about. It is fast, focused, and cost-friendly for small gene panels.
RNA-seq is better when researchers want a broad view, such as finding new pathways, unknown transcripts, splice variants, or large expression patterns.
Many studies use both. RNA-seq may identify candidate genes, then RT-qPCR may confirm selected changes in more samples.
RT-qPCR is like checking a few chosen gauges very carefully. RNA-seq is like scanning the whole dashboard.
Why PCR Is Still Used for Gene Expression Research
PCR remains widely used because it is sensitive, specific, and practical. A lab can measure gene activity from small sample amounts and get results quickly.
It also works well for validation. When a larger method points to a gene of interest, RT-qPCR can test that gene in a focused way.
Clinical and research labs also trust RT-qPCR because the workflow is familiar. The machines are common, the reagents are widely available, and the analysis methods are well established.
The method is not perfect, but it is dependable when the experiment is built with good controls and clean sample handling.
How to Explain PCR Gene Expression in One Simple Example
Imagine researchers want to know whether a drug increases the expression of an inflammation gene.
They grow two groups of cells. One group gets no drug. The other group gets the drug.
They extract RNA from both groups.
They convert RNA into cDNA.
They run qPCR with primers for the inflammation gene and a stable reference gene.
The drug-treated cells show a lower Ct for the inflammation gene than untreated cells.
After normalization, the ΔΔCt calculation shows a four-fold increase.
The result suggests that the drug increased mRNA expression of that inflammation gene.
That does not prove the protein also increased. It does show that the RNA message for that gene became more abundant under the drug condition.
Does PCR Tell Whether a Gene Is Turned On or Off?
PCR can tell whether RNA from a gene is detected and how much is present compared with another sample. It is often used to describe genes as upregulated, downregulated, or unchanged.
If a gene has no detectable Ct after a proper number of cycles, it may be off, extremely low, degraded, or below the assay’s detection limit.
If the gene gives a clear Ct and clean amplification curve, it is being expressed at a detectable level.
When comparing two groups, PCR can show whether the gene’s RNA level went up or down.
Still, gene expression is not always a simple on/off switch. Many genes work on a scale. A small change may matter in one pathway, while a larger change may have little biological effect in another.
How Should PCR Gene Expression Results Be Read?
PCR gene expression results should be read as relative RNA signals supported by controls, not as isolated Ct values.
A strong result usually has clean amplification curves, stable reference genes, good PCR efficiency, biological replicates, and a clear comparison group.
A weak result may rely on one reference gene that was never tested, one sample per group, high Ct values near the detection limit, or fold changes without variation shown.
Good RT-qPCR interpretation asks three questions:
- Was the RNA sample good?
- Was the assay specific and efficient?
- Was the expression change consistent across biological replicates?
When those answers are strong, RT-qPCR can give a clear picture of how gene activity changed.
PCR Measures Gene Expression by Turning RNA Signals Into Comparable Numbers
PCR measures gene expression through RT-qPCR, where RNA is copied into cDNA and then measured during real-time amplification. The earlier the fluorescent signal appears, the more target RNA was likely present in the original sample.
The real value of the method comes from comparison. A target gene is measured against a reference gene, then one sample is compared with another. That process turns invisible RNA activity into fold-change numbers researchers can read and test.
RT-qPCR is not a full story of the cell. It does not measure protein, pathway activity, or final biological effect by itself. But it gives one of the clearest views of gene-level activity when the question is focused: did this gene’s RNA go up, go down, or stay about the same?
Used with clean RNA, smart controls, tested reference genes, and honest analysis, PCR becomes more than a copying reaction. It becomes a way to listen to what a cell is trying to say.